X
 
  • Time
  • Show
Clear All
new posts
  • frizzlefry
    Member
    • Dec 2012
    • 67

    #1

    Remote data logging/monitoring via wifi/RF

    With our system almost completely installed (still have some time before the utility signs off and we can flip the switch), I started researching various options for remote monitoring and logging of power output/usage. I know I will have access to Sunpower's monitoring, but what are my other options? We will be getting an SMA inverter put in and I know there are a few options from SMA (webbox or sunny beam) to log the data.

    I thought it would be good to have a remote display of some sort in the house so we know what the current power output form the array is and how much our consumption is at any given time of day. I did see the Solar Log 200... anyone have experience with these products? I did a search but I found only very limited discussion.

    I just realized that what I'm describing above would need to cover both inverter monitoring as well as meter monitoring.
  • Volusiano
    Solar Fanatic
    • Oct 2013
    • 697

    #2
    I don't think SMA options will give you meter monitoring. But if you have a smart meter with your utility company, I think you may be able to monitor your usage chart on a daily basis through your online account with your utility company. In my case, what I see online, however, is the net effect and not the actual usage because the utility meter is rolled back due to your demand every day. But if you can monitor how much is produced by your solar system everyday, you can simply combine the 2 to calculate what your actual usage is.

    I have an SMA Sunny Boy 4000TL and a 7000 and I bought a Sunny WebBox but learn that the 4000TL doesn't support the WebBox yet. Also, it's not a wifi solution. It's a bluetooth connection between the Sunny Boy and the WebBox, and the WebBox has to be ethernet hardwired to your router. So if your router is out of bluetooth range with your Sunny Boy then it won't work unless you use a range extender of some sort.

    My installer told me that SMA told them there'll be a wifi solution available for the Sunny Boys in about 6 months and it's going to be much cheaper than the WebBox option right now. So I opted to return my WebBox and wait for this new wifi solution.

    Comment

    • frizzlefry
      Member
      • Dec 2012
      • 67

      #3
      Originally posted by Volusiano
      I don't think SMA options will give you meter monitoring. But if you have a smart meter with your utility company, I think you may be able to monitor your usage chart on a daily basis through your online account with your utility company. In my case, what I see online, however, is the net effect and not the actual usage because the utility meter is rolled back due to your demand every day. But if you can monitor how much is produced by your solar system everyday, you can simply combine the 2 to calculate what your actual usage is.

      I have an SMA Sunny Boy 4000TL and a 7000 and I bought a Sunny WebBox but learn that the 4000TL doesn't support the WebBox yet. Also, it's not a wifi solution. It's a bluetooth connection between the Sunny Boy and the WebBox, and the WebBox has to be ethernet hardwired to your router. So if your router is out of bluetooth range with your Sunny Boy then it won't work unless you use a range extender of some sort.

      My installer told me that SMA told them there'll be a wifi solution available for the Sunny Boys in about 6 months and it's going to be much cheaper than the WebBox option right now. So I opted to return my WebBox and wait for this new wifi solution.
      Thanks for the info. I guess that would work but I hate using SCEs site

      I'm doing more research online. There are home energy monitoring devices that can do multiple sources. So I think I can put the sensors on the inverter and the actual meter. That'll give me more granular production and usage stats.

      Comment

      • PenguinSolar
        Solar Fanatic
        • Jul 2013
        • 110

        #4
        Originally posted by frizzlefry
        Thanks for the info. I guess that would work but I hate using SCEs site

        I'm doing more research online. There are home energy monitoring devices that can do multiple sources. So I think I can put the sensors on the inverter and the actual meter. That'll give me more granular production and usage stats.
        *Bump* as I'm curious on possible solutions of having further monitoring options and analysis.

        With my setup from Sullivan, I have a SMA 4000TL-US, they added the RS485 module which plugs into a Locus Monitoring which they also monitor and accessible via a the Locus web portal. However, the portal does not allow any auto-pushes (like if I want to output to PVoutput.org). You can manually download and upload (but who wants to do that! ).

        SMA does have a webconnect module for their TL models which outputs to the Sunny Portal but that requires swapping out the RS485 module (plus also getting the Webconnect device too). I can't swap out the RS485 module as that's what my installer is using to connect to the Locus monitor to monitor the system since they are "guaranteeing" the solar product output require to see the data.

        I'm wondering if you can daisy-chain the RS485 connector to go into multiple modules so still go to Locus for my installer to see but then chain another monitor for my purposes. Possible?

        I also read in the SMA-4000TL-US manual there seems to be a Zigbee option (although can't find anything on the website about it). With Zigbee could possibly get a Zigbee gateway device like Rainforest Eagle which can pull the data.

        My ultimate goal is be able to more granular data and being to upload my data up to PVOutput.org so I can easily compare with others and keep historical data.

        I guess my other choices would be:
        - A TED device which can easily upload to PVoutput.org
        - Upgrade my SmartMeter to be Zigbee compatible and then get the RainForest Eagle gateway which can then interface with Wattvision which can then output to PVoutput.org

        However, both these use "calculated" methods to determine the solar output and do not directly talk to the inverter so maybe less accurate?

        I'm leaning toward the later (already put in the request to SCE to upgrade my meter) but not sure if anyone is actually doing that setup. Be good to hear confirmation from someone that has been successful.

        I'm wondering what setup more people are doing for remote monitoring BEYOND what the installer already provides?

        Thanks!

        Comment

        • frizzlefry
          Member
          • Dec 2012
          • 67

          #5
          Originally posted by PenguinSolar
          *Bump* as I'm curious on possible solutions of having further monitoring options and analysis.

          With my setup from Sullivan, I have a SMA 4000TL-US, they added the RS485 module which plugs into a Locus Monitoring which they also monitor and accessible via a the Locus web portal. However, the portal does not allow any auto-pushes (like if I want to output to PVoutput.org). You can manually download and upload (but who wants to do that! ).

          SMA does have a webconnect module for their TL models which outputs to the Sunny Portal but that requires swapping out the RS485 module (plus also getting the Webconnect device too). I can't swap out the RS485 module as that's what my installer is using to connect to the Locus monitor to monitor the system since they are "guaranteeing" the solar product output require to see the data.

          I'm wondering if you can daisy-chain the RS485 connector to go into multiple modules so still go to Locus for my installer to see but then chain another monitor for my purposes. Possible?

          I also read in the SMA-4000TL-US manual there seems to be a Zigbee option (although can't find anything on the website about it). With Zigbee could possibly get a Zigbee gateway device like Rainforest Eagle which can pull the data.

          My ultimate goal is be able to more granular data and being to upload my data up to PVOutput.org so I can easily compare with others and keep historical data.

          I guess my other choices would be:
          - A TED device which can easily upload to PVoutput.org
          - Upgrade my SmartMeter to be Zigbee compatible and then get the RainForest Eagle gateway which can then interface with Wattvision which can then output to PVoutput.org

          However, both these use "calculated" methods to determine the solar output and do not directly talk to the inverter so maybe less accurate?

          I'm leaning toward the later (already put in the request to SCE to upgrade my meter) but not sure if anyone is actually doing that setup. Be good to hear confirmation from someone that has been successful.

          I'm wondering what setup more people are doing for remote monitoring BEYOND what the installer already provides?

          Thanks!
          I'm currently using the Eagle but having it talk to bidgely . com

          Their website provides me with the ability to see Teal time net consumption along with cost. I've been checking the numbers less and less and some point may get the BT module for the inverter but I'm seeing less and less of a point in doing so as what I'm realizing I'm most concerned about is really the net effect of the system. I can spot check with the Locus site to see if on a full sunny day the output is where it should be.

          At the same time, the Locus site sends me an email daily with a spreadsheet of 5min interview production numbers for the past 3 days. I haven't written a script yet and I may never get around to it but I could always parse the historical data later on.

          Comment

          • wwu123
            Solar Fanatic
            • Apr 2013
            • 140

            #6
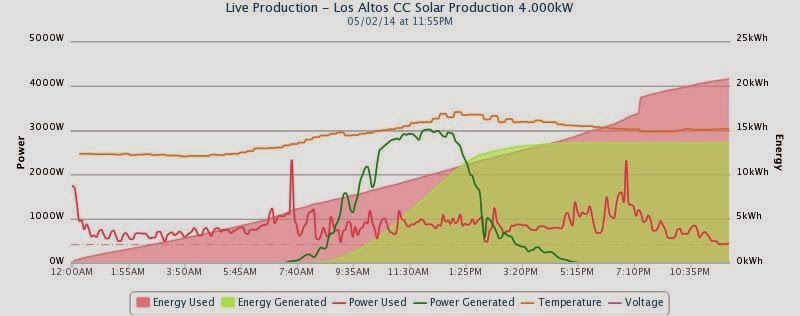
            My own solar array went online in late November and I just got remote/web logging and monitoring set up. Here is a screenshot from pvoutput.org:


            The nice thing with pvoutput is that I'm actually consolidating three different realtime sources, that I formerly had to go to different monitoring sites:
            1) Enphase microinverters for solar production, logged on Enlighten site but auto-uploaded via API;
            2) Rainforest Eagle for net consumption, from utility Smart Net meter via Zigbee, logged on Wattvision site and auto-uploaded via API;
            3) Acu-rite weather station for temperature/weather, logged on Acu-link site and uploaded to Wunderground and from there auto-uploaded via API

            The temp is the orange line in upper part of the graph but has no visible axis so you have to hover over the lines to get the value, or use the tabular data also on pvoutput pages. The pvoutput site was just enhanced a few weeks ago to properly interpret the Eagle for net consumption, and the site backs out whole house consumption values automatically - to unlock this feature you have to make a small donation of about $10.

            I've looked at the TED, but the Eagle is a lot cheaper and can give both net AND household consumption when combined with Enphase data through pvoutput. It's a lot simpler to install assuming you have a Zigbee supported meter. Although the steps to get my utility to authorize and pair the Zigbee meter was a bit of a hassle. Also a few years ago I tried a Blue Line Innovations Powercost monitor on an analog meter - it was very flaky with the wireless connection and I gave up on it; I don't think the hardware has been revised in years.

            pvoutput also allows manual uploading of a bunch of your own custom data as well. I have two indoor temp sensors that are logged at Acu-link but I hope to figure out a script to auto-upload them as well so I can consolidate everything in one place.

            The true household consumption has been great to identify the realtime power consumption of devices around the house, esp those that I can't use a Kill-a-Watt easily, such as the fridge or furnace. I tried Bidgely for a few days, it claims to be able to isolate individual appliances based on data analytics, but didn't seem to figure mine out - I have two variable-speed compressors in the fridge and a three-speed furnace, so neither one's consumption is a clean step function, so I think Bidgely can't see what I can see visualized in the graphs. I still have Bidgely getting daily/hourly summaries from the utility's website.

            Comment

            • frizzlefry
              Member
              • Dec 2012
              • 67

              #7
              Originally posted by wwu123
              My own solar array went online in late November and I just got remote/web logging and monitoring set up. Here is a screenshot from pvoutput.org:


              The nice thing with pvoutput is that I'm actually consolidating three different realtime sources, that I formerly had to go to different monitoring sites:
              1) Enphase microinverters for solar production, logged on Enlighten site but auto-uploaded via API;
              2) Rainforest Eagle for net consumption, from utility Smart Net meter via Zigbee, logged on Wattvision site and auto-uploaded via API;
              3) Acu-rite weather station for temperature/weather, logged on Acu-link site and uploaded to Wunderground and from there auto-uploaded via API

              The temp is the orange line in upper part of the graph but has no visible axis so you have to hover over the lines to get the value, or use the tabular data also on pvoutput pages. The pvoutput site was just enhanced a few weeks ago to properly interpret the Eagle for net consumption, and the site backs out whole house consumption values automatically - to unlock this feature you have to make a small donation of about $10.

              I've looked at the TED, but the Eagle is a lot cheaper and can give both net AND household consumption when combined with Enphase data through pvoutput. It's a lot simpler to install assuming you have a Zigbee supported meter. Although the steps to get my utility to authorize and pair the Zigbee meter was a bit of a hassle. Also a few years ago I tried a Blue Line Innovations Powercost monitor on an analog meter - it was very flaky with the wireless connection and I gave up on it; I don't think the hardware has been revised in years.

              pvoutput also allows manual uploading of a bunch of your own custom data as well. I have two indoor temp sensors that are logged at Acu-link but I hope to figure out a script to auto-upload them as well so I can consolidate everything in one place.

              The true household consumption has been great to identify the realtime power consumption of devices around the house, esp those that I can't use a Kill-a-Watt easily, such as the fridge or furnace. I tried Bidgely for a few days, it claims to be able to isolate individual appliances based on data analytics, but didn't seem to figure mine out - I have two variable-speed compressors in the fridge and a three-speed furnace, so neither one's consumption is a clean step function, so I think Bidgely can't see what I can see visualized in the graphs. I still have Bidgely getting daily/hourly summaries from the utility's website.
              Bidgely has always stated they cannot determine consumption patterns with solar systems installed.

              I haven't dealt with anything else besides looking at my net consumption and pv array generation. It's been enough for me. I've also been a lot more busy with work so less time with data manipulation. congrats on your system.

              Comment

              • PenguinSolar
                Solar Fanatic
                • Jul 2013
                • 110

                #8
                Originally posted by wwu123
                My own solar array went online in late November and I just got remote/web logging and monitoring set up. Here is a screenshot from pvoutput.org:


                The nice thing with pvoutput is that I'm actually consolidating three different realtime sources, that I formerly had to go to different monitoring sites:
                1) Enphase microinverters for solar production, logged on Enlighten site but auto-uploaded via API;
                2) Rainforest Eagle for net consumption, from utility Smart Net meter via Zigbee, logged on Wattvision site and auto-uploaded via API;
                3) Acu-rite weather station for temperature/weather, logged on Acu-link site and uploaded to Wunderground and from there auto-uploaded via API

                The temp is the orange line in upper part of the graph but has no visible axis so you have to hover over the lines to get the value, or use the tabular data also on pvoutput pages. The pvoutput site was just enhanced a few weeks ago to properly interpret the Eagle for net consumption, and the site backs out whole house consumption values automatically - to unlock this feature you have to make a small donation of about $10.

                I've looked at the TED, but the Eagle is a lot cheaper and can give both net AND household consumption when combined with Enphase data through pvoutput. It's a lot simpler to install assuming you have a Zigbee supported meter. Although the steps to get my utility to authorize and pair the Zigbee meter was a bit of a hassle. Also a few years ago I tried a Blue Line Innovations Powercost monitor on an analog meter - it was very flaky with the wireless connection and I gave up on it; I don't think the hardware has been revised in years.

                pvoutput also allows manual uploading of a bunch of your own custom data as well. I have two indoor temp sensors that are logged at Acu-link but I hope to figure out a script to auto-upload them as well so I can consolidate everything in one place.

                The true household consumption has been great to identify the realtime power consumption of devices around the house, esp those that I can't use a Kill-a-Watt easily, such as the fridge or furnace. I tried Bidgely for a few days, it claims to be able to isolate individual appliances based on data analytics, but didn't seem to figure mine out - I have two variable-speed compressors in the fridge and a three-speed furnace, so neither one's consumption is a clean step function, so I think Bidgely can't see what I can see visualized in the graphs. I still have Bidgely getting daily/hourly summaries from the utility's website.
                Pretty cool!

                When you say auto-uploaded via API, is that just a PVoutput.org job that pulls data from Enphase and Wattvision? Or is there a job on on the Enphase and Wattvision that pushes it to PVoutpout.org. Is there a list of API partners that PVoutput.org supports?

                My issue is I'm locked into a Locus Monitoring via Sullivan Solar, which doesn't appear to offer any external APIs or output. I can run pretty reports, but can't export the data .

                I have a Rainforest which I guess I can hook to Wattvision (currently using Bidgely -- can only pick one) to push to PVOutput.org, however it's only net consumption (I believe).

                Apparently, my SCE smartmeter has a 2nd channel which captures the energy generation, this is how they calculate my bills. What I'm not sure is if this data comes over Zigbee to Rainforest and can I actually see it. Right now I only see net consumption.

                So that's one way to get generation (if possible), the other is to see if I can "hack" locus monitoring, or possibly see if I can add something to my SMA (maybe a bluetooth add-on) that can also output the generation, although it already has a monitoring module installed.

                Guess worst, is once SCE has updated my rate plan, I should be able to see the generation and from there they do let me export my data (The Green Button), however that's manual and not automatic, unless there's some API.

                Comment

                • russ
                  Solar Fanatic
                  • Jul 2009
                  • 10360

                  #9
                  Come on guys - It isn't necessary to copy the entire post each time.
                  [SIGPIC][/SIGPIC]

                  Comment

                  • wwu123
                    Solar Fanatic
                    • Apr 2013
                    • 140

                    #10
                    Originally posted by PenguinSolar
                    Pretty cool!

                    When you say auto-uploaded via API, is that just a PVoutput.org job that pulls data from Enphase and Wattvision? Or is there a job on on the Enphase and Wattvision that pushes it to PVoutpout.org. Is there a list of API partners that PVoutput.org supports?
                    Yes, normally you have to push data to pvoutput.org's API, but for Enphase, Wattvision, Wunderground and some other services, there's a pvoutput job or script that pulls data at regular intervals from the pull API's from the other sites, that they call their auto-uploaders. To prevent abuse of their websites, all of them have API keys you have to retrieve from your accounts and enter into pvoutput's configuration to have the auto-uploading work. There are the ones they
                    Cosm
                    Enphase
                    Flukso
                    TED5000
                    Weather (Wunderground)
                    Wattvision
                    Webbox
                    EKM Meter
                    AlertMe
                    Billion Gateway

                    You could use a TED5000 to measure generation, if you do that you might also get two of the clamps to measure both generation and consumption, as pvoutput says they can take both sets of data from TED.

                    Comment

                    • jennifermehl
                      Junior Member
                      • Oct 2013
                      • 10

                      #11
                      I would love more information from anyone with a Fronius inverter on monitoring. I got our installer to throw in a Locus Monitoring LGate 120, which is fine, but very limited in what it displays on our Locus web portal. Apparently it is also some type of "prepaid" 5 year subscription with Locus, and who knows what happens after that.

                      I am interested in getting a Fronius Datamanager (WiFi) for our IG Plus 6.0 inverter and outputting the data to the Fronius and PVOutput sites. Would love more info from anyone else who has done this.

                      Thanks!

                      Comment

                      • logdin
                        Member
                        • Oct 2013
                        • 70

                        #12
                        sullivan and pvoutput

                        has anyone been successful getting their Sullivan Solar installed system on PVoutput? What did it take?
                        [I][url]http://pvoutput.org/list.jsp?userid=27957[/url][/I]

                        Comment

                        • silversaver
                          Solar Fanatic
                          • Jul 2013
                          • 1390

                          #13
                          Originally posted by logdin
                          has anyone been successful getting their Sullivan Solar installed system on PVoutput? What did it take?
                          Sullivan uses Locus monitorign which cannot support PVoutput. You can get a TED 5000 system for $300 and it will works with PVOutput. I have a TED 5000 and it works great, but I don't feel the need to upload the datas.

                          Comment

                          • logdin
                            Member
                            • Oct 2013
                            • 70

                            #14
                            re:sullivan and pvoutput

                            Originally posted by silversaver
                            Sullivan uses Locus monitorign which cannot support PVoutput. You can get a TED 5000 system for $300 and it will works with PVOutput. I have a TED 5000 and it works great, but I don't feel the need to upload the datas.
                            I thought the TED was for monitoring consumption. Are you saying it can do solar generation and consumption for PVOutput?
                            [I][url]http://pvoutput.org/list.jsp?userid=27957[/url][/I]

                            Comment

                            • inetdog
                              Super Moderator
                              • May 2012
                              • 9909

                              #15
                              Originally posted by logdin
                              I thought the TED was for monitoring consumption. Are you saying it can do solar generation and consumption for PVOutput?
                              It will measure energy. Depending on where you put the current sensors, it will measure consumption, production or net of the two (POCO power).
                              SunnyBoy 3000 US, 18 BP Solar 175B panels.

                              Comment

                              Working...