When the number of AH on a battery is used what will voltage be?

Collapse
X
 
  • Time
  • Show
Clear All
new posts
  • copymepls
    Junior Member
    • Nov 2014
    • 45

    #1

    When the number of AH on a battery is used what will voltage be?

    For example I have 8 6v 230ah ACDELCO 845A in series and when I disconnected all loads and charged them all the way up with my panels and mppt till the voltage stopped climbing and then left them at float voltage for another day and then disconnected the batteries from the controller and left them overnight I measured the voltage and it was 52.3v, sounds like they are full to me.

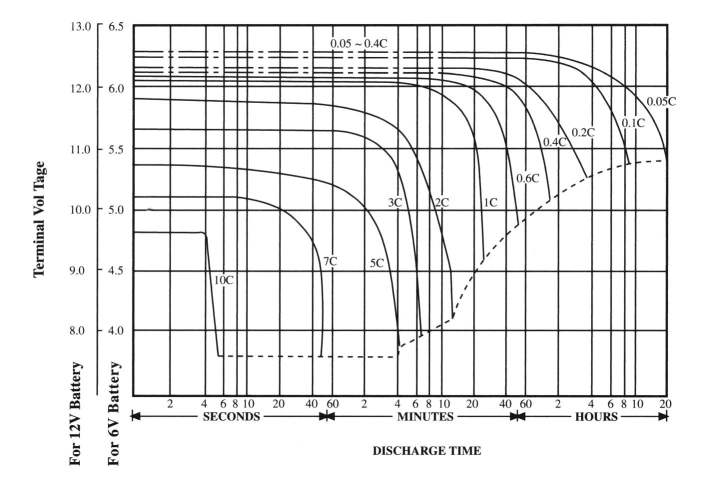
    If I then were to discharge them at a rate of 11.5 amps each hour for 20 hours so I use what the manufacturer declares the AH to be then what will my voltage be at the end after disconnecting all loads and waiting a few hours before measuring the voltage?

    Please use examples of any batteries you are very familiar with.
  • Sunking
    Solar Fanatic
    • Feb 2010
    • 23301

    #2
    There is no way you can determine the AH in a battery by reading the voltage. That can only be done with a capacity test which is way beyond most peoples capability. At best all you can do is assume from the SOC voltage which is pretty much meaningless.

    State of Charge voltage (SOC). It is not accurate and cannot be used on a battery that is being charged or discharged, only OPEN CIRCUIT. It is a ball park estimation of a fully rested disconnected battery which you preformed. Only accurate way to determine the battery SOC is with a temperature corrected hydrometer no battery owner should be without. But that will not tell you the capacity.

    FWIW here is the table for SOC voltages.

    MSEE, PE

    Comment

    • copymepls
      Junior Member
      • Nov 2014
      • 45

      #3
      You misunderstood my question. I'm simply asking how much battery voltage will differ when all the AH a manufacturer declares on a battery is consumed.

      Comment

      • Sunking
        Solar Fanatic
        • Feb 2010
        • 23301

        #4
        Originally posted by copymepls
        You misunderstood my question. I'm simply asking how much battery voltage will differ when all the AH a manufacturer declares on a battery is consumed.
        I don't think I misunderstand you, read the chart. Only thing missing is 0% = 45.65 volts which you never ever want to see, or go below 50% SOC

        Here is another chart from Trojan which tells you the exact same thing. The difference will be 50.92 - 45.65 = 5.27 volts when the battery becomes a boat anchor.
        MSEE, PE

        Comment

        • copymepls
          Junior Member
          • Nov 2014
          • 45

          #5
          Reason I'm asking this question is I want to know how voltage scales with amps deducted from the battery. So stop trying to assume I'm trying to calculate remaining capacity. I want to know how much the voltage changes if the 230ah the manufacturer claims is depleted over a 20hr rate. If I have a full 230ah battery at 6.5375 volts and I use 230 amphours over a 20 hr rate how will it affect voltage if temperature remains constant?

          This question is for someone who has data from a battery depletion test where the room temperature for the entire few days of this test remained the same temperature.

          1st. The battery was fully charged and then was left to stabilize by itself (open circuit).
          2nd. The voltage was measured and recorded at the start or recorded for the entire duration of the test.
          3rd. The battery was given a constant resistance load for exactly 20 hours, therefore the load is 1/20 of the amphours on the sticker of the battery.
          4th. The battery was left for a few hours and the voltage was measured again.

          I expect this data to come from a manufacturer or any entity that felt like performing this test. This data would be a specific brand and model and this battery was new when the test performed.

          I am looking for a chart showing voltage curve from a 20hr depletion test at the manufacturers stated amphour rating. If anyone reading has one of these charts please link it.

          Comment

          • Sunking
            Solar Fanatic
            • Feb 2010
            • 23301

            #6
            Originally posted by copymepls
            I am looking for a chart showing voltage curve from a 20hr depletion test at the manufacturers stated amp hour rating. If anyone reading has one of these charts please link it.
            You are asking for proprietary information which is closely guarded. Those charts exist from some battery manufactures but not all. Mainly the industrial manufactures like C&D, Exide, and East Penn in their Industrial product lines. They are not public and usually restricted to professionals in the industry. Only other way is to contact the local manufacture rep and ask for a copy of a specific model of interest. They may or may not grant you access. It is not something the manufactures make public.

            IEEE and other professional organizations in the trade offer them to members for a fee. You might go that route if the rep does not grant your request for info. I am a member/contributor to IEEE committees 450/455 and have the charts for C&D, Exide, and East Penn Industrial line. For a fee I can hook you up.
            MSEE, PE

            Comment

            • copymepls
              Junior Member
              • Nov 2014
              • 45

              #7
              What names do these charts go by? I recall looking at one in recent years but I don't remember much.

              Are there any charts floating around the internet for a typical 6v 230ah flooded golf cart battery?

              Comment

              • inetdog
                Super Moderator
                • May 2012
                • 9909

                #8
                One other thing you need to understand is that when a battery is nominally at zero SOC, the voltage will not be zero, but it will be so low, and will drop so sharply if current is drawn from it that it will no longer be a useful source of power.
                Rather than asking what the voltage will be when the battery reaches zero SOC, you need to ask how a particular battery manufacturer or test procedure decides when to call the battery to be at zero SOC.
                And, as Dereck stated indirectly, if you actually go to zero SOC you risk doing permanent damage to the battery, reducing its capacity in the future.
                So the endpoint for a practical capacity test should be some point above zero SOC in the voltage/SG chart, with the remaining capacity from there being extrapolated.

                Leaving a battery at zero SOC for any length of time will invite more and more damage to the active material in the cells and will make it harder to both quickly and safely recharge the battery. Many Charge Controllers (CCs) will not even recognize a lead acid battery that has dropped too far below the defined end point voltage.

                (FYI, Lithium chemistry batteries, by contrast, will also lose their ability to tolerate charging current the closer they get to the zero SOC point for those batteries. And rechargeable Lithium batteries will permanently lose capacity when called on to deliver more power beyond the defined zero point. There will still be power available, and it may be useful as an emergency reserve, but the battery will never recover from that.)
                SunnyBoy 3000 US, 18 BP Solar 175B panels.

                Comment

                • copymepls
                  Junior Member
                  • Nov 2014
                  • 45

                  #9
                  I'm aware of the sulfate damage to lead acid batteries and how much they love to be at float voltage. I don't plan on depleting them below 50v on a daily basis. This is why I ask theoretically on a forum about their voltage after using all 230ah instead of me actually draining them that far. As I understand a flooded lead acid has about 500-800 life cycles being drained to 1.95v per cell each time. These are new and can hold 52.3v/2.18v, as the batteries age they won't hold that voltage. If I don't go below 2.08v per cell and I bring them back up to full by having enough panels and equilize them once a month then they should last 5-10 years. Now if only I could convince my friend to buy 10 280w panels instead of trying to squeeze by with 6.

                  I have a meter between the MPPT and the batteries, it can measure V A W Ah Ap Wh Wp Vm, I'm ordering another meter to put between the batteries and loads when I find one heavy duty enough with the ability to log properly, loads are inverter for house power, and a 48v waterheater as a diversion load. Also getting a p4400 kill-a-watt meter so my friend can measure everything in his house and learn about his power consumption. It's my friends system at his house.

                  I'll also install an adjustable low-voltage-disconnect between the loads and batteries so my friend can't go below about 50v. Thing is that the loads will demand alot of current for short bursts of time, so they might bring the system below 50v but when the load stops it should rise above 50v, I could either set the LVD at 49.5 or I could try to find a LVD that monitors the average voltage over the last 10 minutes, and opens the circuit when it averages a desired voltage like 50v.

                  I will also have him practice using the hydrometer.

                  Comment

                  • inetdog
                    Super Moderator
                    • May 2012
                    • 9909

                    #10
                    When you say that the batteries will not hold their voltage as they age, it suggests to me that you may have a misconception about how lead acid batteries work.
                    As long as you do not have sulfation, but some other type of plate degeneration with age, the full charge hydrometer reading and the open circuit voltage will not change significantly. What will change is how much energy you can remove before the voltage drops to some particular level.

                    The table showing voltage versus SOC should be interpreted as showing voltage versus percentage of the batteries capacity at that stage of its life, not the percentage of its original new capacity.
                    That is what makes it so hard to determine the capacity of an old battery without actually doing a load test with a significant discharge.

                    If you have significant sulfation, then there is less acid in the electrolyte to work with and the full charge SG will in fact be lower, and the resting voltage may be lower for that reason. But a much better indication will be the load test. Although you do not have the equipment to do a valid constant current capacity test, you can still get a better idea of the remaining battery capacity that way than via voltage or SG measurements.
                    SunnyBoy 3000 US, 18 BP Solar 175B panels.

                    Comment

                    • Sunking
                      Solar Fanatic
                      • Feb 2010
                      • 23301

                      #11
                      Let's see if we can get you on the right track. What you are asking for is Battery Discharge Curves as shown below. OK what you are looking at is a battery that is first fully charged up, and then discharged at multiple discharge rates sometimes expressed as C rate or Hour rate. The two terms are interchangeable. It is graphed as voltage on the Vertical line, and Time on Horizontal line.

                      Manufactures specify batteries in Amp Hours at some given Hour rate. Consumer batteries are typically specified at the 20 hour discharge rate, and industrial at the 8 hour. For example a battery very simular to one you asked about is a Rolls S-290. Click on the link and you can see this battery is marketed as a 6 volt 220 AH battery. Same battery rated at 8 hours is 176 AH battery. At 1 hour discharge rate (79 amps) only 79 AH. That is Peukert Law.

                      Discharge curves give you that information, but it also gives you something else more important. A function of the batteries internal resistance. That is important because it tells you the maximum Discharge rate you can load th ebattery up with before it becomes useless.

                      So for argument sake lets say the graph below is a 6 volt 230 AH battery. The graph is typical of any deep cycle battery of any voltage or capacity. Th every top line is .05C which means if the battery is 230 AH a load of .05 x 230 AH = 11.5 amps. .05C = C/20. 230AH / 20 hours = 11.5 amps. Note the voltage of the 6 volt drops little from 6.3 volts and takes 20 hours to drop off to fully discharged.

                      Now lets recharge the battery and hit with a 10 hour discharge rate of 23 amps. That is the .01C or C/10 rate. Look what happened to the battery voltage. At fully charged it immediately drops to 6.2 volts or 1.6% voltage loss. Now move down to the .2C rate or C/5. You drop immediately from 6.3 to 6.1 volts or 3.1% loss. At C/5 the battery is pretty much unusable.

                      Your take away here is should be this. In any battery system you want to limit losses to 2% or less on the battery post, and no more than 1% on the wiring between the battery post and the load device input terminal. After you look at hundreds of discharge curves a pattern develops. That pattern is for Flooded Lead Acid batteries limit discharge and charge rate to no more than C/8, and AGM batteries to C/4.

                      It all has to do with the batteries internal resistance. Also note consumer batteries are rate at 20 hour rates, and industrial batteries at 8 hour rates. Take my above example of the Rolls S-290 and let's turn it around. A 230 AH C/8 battery is roughly the same as a 320 AH C/20 battery.

                      MSEE, PE

                      Comment

                      • Mike90250
                        Moderator
                        • May 2009
                        • 16020

                        #12
                        Battery discharge profiles change over time. When your 500ah bank is new, you have the original curve. When it's 4 years old, the curve will look like a 200ah battery bank. As the batteries age, they deteriorate. Plate material sheds. Plates warp, insulators get clogged with silt or something. Sulfate builds up, and more capacity is lost. After the first week, the curve starts to change, but specific gravity measurements are the only true indicator of State Of Charge. For 40 years, % remaining has been tried based on volts, the TriMetric Meter is about the closest thing to a SOC meter that there is. http://www.bogartengineering.com/ The meters use a shunt to monitor the amps in and out.
                        Powerfab top of pole PV mount (2) | Listeroid 6/1 w/st5 gen head | XW6048 inverter/chgr | Iota 48V/15A charger | Morningstar 60A MPPT | 48V, 800A NiFe Battery (in series)| 15, Evergreen 205w "12V" PV array on pole | Midnight ePanel | Grundfos 10 SO5-9 with 3 wire Franklin Electric motor (1/2hp 240V 1ph ) on a timer for 3 hr noontime run - Runs off PV ||
                        || Midnight Classic 200 | 10, Evergreen 200w in a 160VOC array ||
                        || VEC1093 12V Charger | Maha C401 aa/aaa Charger | SureSine | Sunsaver MPPT 15A

                        solar: http://tinyurl.com/LMR-Solar
                        gen: http://tinyurl.com/LMR-Lister

                        Comment

                        • copymepls
                          Junior Member
                          • Nov 2014
                          • 45

                          #13
                          Awesome information, I like being really comprehensive with electrical engineering.

                          Now I am wondering about charts showing recharge curves, how much over how many hours at different voltages will deep cycles like the rolls 290 absorb?

                          Comment

                          • inetdog
                            Super Moderator
                            • May 2012
                            • 9909

                            #14
                            Originally posted by copymepls
                            Awesome information, I like being really comprehensive with electrical engineering.

                            Now I am wondering about charts showing recharge curves, how much over how many hours at different voltages will deep cycles like the rolls 290 absorb?
                            As long as you limit the voltage to the manufacturer-specified Absorb voltage, keeping that voltage indefinitely will just cause more water to electrolyze off, and in the really long term may cause plate corrosion or shedding. That is less of a problem with PV installations since the battery will not be on charge continuously.
                            Equalization voltages, on the other hand, will cause battery heating and if unmonitored can seriously damage the cells. Sealed cells, specifically AGM, are more tolerant of high current recharging, but cannot tolerate overcharge beyond a specified voltage without venting electrolyte and losing capacity permanently.
                            GEL cells, OTOH, are particularly vulnerable to damage by charging at a rate above C/20 and should not be used for PV under any circumstances.
                            SunnyBoy 3000 US, 18 BP Solar 175B panels.

                            Comment

                            • Sunking
                              Solar Fanatic
                              • Feb 2010
                              • 23301

                              #15
                              Originally posted by copymepls
                              Now I am wondering about charts showing recharge curves, how much over how many hours at different voltages will deep cycles like the rolls 290 absorb?
                              Not much to look at while charging and no information to be obtained. The battery voltage will quikly jumpt to 14.4 volts on a 12 volt battery and stay there until the charge current tapers down to around 3% and charging terminates.
                              MSEE, PE

                              Comment

                              Working...